HTML Examples
This page provides a list of examples that demonstrate rendering html tables from the given dataframe. Each example is self-contained inside a class. We have some helper functions to provide the data we need for this examples
Helper Functions (Data loading routines)
1 2 3 4 5 6 7 8 9 10 11 12 13 | import tempfile
import zipfile
import collections
import os
import webbrowser
import requests
import pandas as pd
import table_compositor.table_compositor as tc
import table_compositor.html_writer as htmlw
import table_compositor.html_styles as html_style
|
1 2 3 4 5 6 7 8 9 10 11 12 13 14 15 16 17 18 19 20 21 22 23 24 25 26 27 28 29 30 31 32 33 34 35 36 37 38 39 40 | # code snippet adapted from http://function-pipe.readthedocs.io/en/latest/usage_df.html
# source url
URL_NAMES = 'https://www.ssa.gov/oact/babynames/names.zip'
ZIP_NAME = 'names.zip'
def load_names_data():
fp = os.path.join(tempfile.gettempdir(), ZIP_NAME)
if not os.path.exists(fp):
r = requests.get(URL_NAMES)
with open(fp, 'wb') as f:
f.write(r.content)
post = collections.OrderedDict()
with zipfile.ZipFile(fp) as zf:
# get ZipInfo instances
for zi in sorted(zf.infolist(), key=lambda zi: zi.filename):
fn = zi.filename
if fn.startswith('yob'):
year = int(fn[3:7])
df = pd.read_csv(
zf.open(zi),
header=None,
names=('name', 'gender', 'count'))
df['year'] = year
post[year] = df
df = pd.concat(post.values())
df.set_index('name', inplace=True, drop=True)
return df
def sample_names_data():
df = load_names_data()
df = df[(df['year'] == 2015) & (df['count'] > 1000)]
return df.sample(50, random_state=0).sort_values('count')
def top_names_for_year(year=2015, gender='F', top_n=5):
df = load_names_data()
df = df[(df['year'] == year) & (df['gender'] == gender)]
df = df.sort_values('count')[:top_n]
return df
|
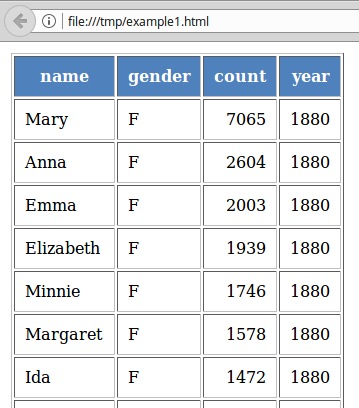
Example 1 - DataFrame with default styles
Demonstrates converting dataframe into html format with default styles.
1 2 3 4 5 6 7 8 9 10 11 12 13 14 15 16 17 18 19 20 21 22 23 24 25 | class HTMLExample1:
'''
Demonstrate rendering of a simple dataframe into html
'''
@classmethod
def render_html(cls):
# load data
df = load_names_data()
df = df[:100]
# build presentation model
pm = tc.build_presentation_model(df=df, output_format='html')
# render to xlsx
tempdir = tempfile.gettempdir()
fp = os.path.join(tempdir, 'example_1.html')
layout = [pm]
print('Writing to ' + fp)
html = htmlw.HTMLWriter.to_html(layout, border=1)
output_fp = os.path.join(
tempfile.gettempdir(),
'example1.html')
with open(output_fp, 'w') as f:
f.write(html)
|
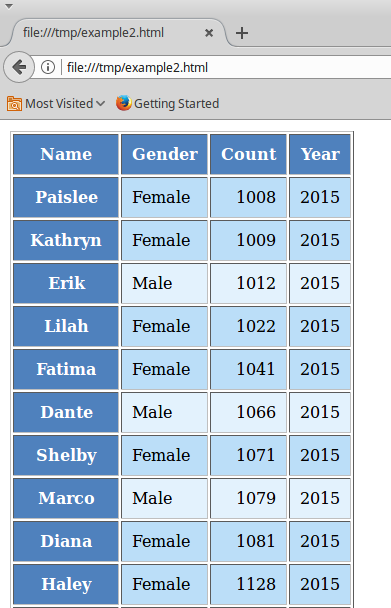
Example 2 - DataFrame with custom styles
In this example, we format the different components of dataframe with various styling attributes
1 2 3 4 5 6 7 8 9 10 11 12 13 14 15 16 17 18 19 20 21 22 23 24 25 26 27 28 29 30 31 32 33 34 35 36 37 38 39 40 41 42 43 44 45 46 47 48 49 50 51 52 53 54 55 56 57 58 59 60 61 62 63 64 65 66 67 68 69 70 71 72 73 74 75 76 77 78 79 80 81 82 83 84 85 86 87 88 89 90 91 92 93 94 95 | class HTMLExample2:
'''
Demonstrate rendering of a simple dataframe into html
'''
@staticmethod
def data_value_func(df):
def _inner(idx, col):
if col == 'gender':
if df.loc[idx, col] == 'F':
return "Female"
return 'Male'
return df.loc[idx, col]
return _inner
@staticmethod
def data_style_func(df):
def _inner(idx, col):
color = '#FFFFFF'
text_align = 'left'
if col == 'count':
text_align = 'right'
if df.loc[idx, 'gender'] == 'F':
color = '#bbdef8'
else:
color = '#e3f2fd'
return html_style.td_style(
text_align=text_align,
background_color=color,
color='#000000',
font_weight='normal',
white_space='pre',
padding='10px',
border=None)
return _inner
@staticmethod
def index_name_value_func(value):
return value.capitalize()
@staticmethod
def header_value_func(node):
return node.value.capitalize()
@staticmethod
def header_style_func(node):
return html_style.td_style(
text_align='center',
background_color='#4F81BD',
color='#FFFFFF',
font_weight='bold',
white_space='pre',
padding='10px',
border=1)
@staticmethod
def index_value_func(node):
return node.value.capitalize()
@staticmethod
def index_style_func(node):
return html_style.td_style(
text_align='center',
background_color='#4F81BD',
color='#FFFFFF',
font_weight='bold',
white_space='pre',
padding='10px',
border=1)
@classmethod
def render_html(cls):
# load data
df = sample_names_data()
# build presentation model
klass_ = HTMLExample2
pm = tc.build_presentation_model(
df=df,
output_format='html',
data_value_func=klass_.data_value_func(df),
data_style_func=klass_.data_style_func(df),
header_value_func=klass_.header_value_func,
header_style_func=klass_.header_style_func,
index_style_func=klass_.index_style_func,
index_value_func=klass_.index_value_func,
index_name_func=klass_.index_name_value_func)
layout = [pm]
html = htmlw.HTMLWriter.to_html(layout, border=1)
output_fp = os.path.join(
tempfile.gettempdir(),
'example2.html')
print('Writing to =', output_fp)
with open(output_fp, 'w') as f:
f.write(html)
|
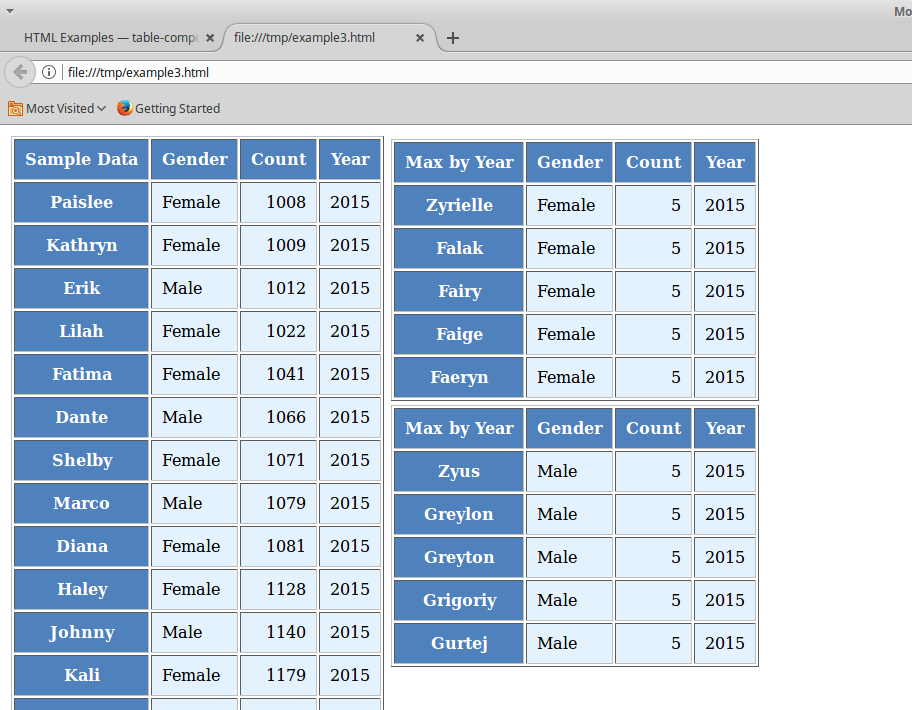
Example 3 - Simple DataFrame with Layouts
Demonstrates rendering dataframes with multi-hierarchical indices and mult-hierarchical columns
1 2 3 4 5 6 7 8 9 10 11 12 13 14 15 16 17 18 19 20 21 22 23 24 25 26 27 28 29 30 31 32 33 34 35 36 37 38 39 40 41 42 43 44 45 46 47 48 49 50 51 52 53 54 55 56 57 58 59 60 61 62 63 64 65 66 67 68 69 70 71 72 73 74 75 76 77 78 79 80 81 82 83 84 85 86 87 88 89 90 91 92 93 94 95 96 97 98 99 100 101 102 103 104 105 106 107 108 109 110 111 112 113 114 115 116 117 118 119 120 121 122 123 124 125 126 | class HTMLExample3:
'''
Demonstrate styling and rendering of multiple multi-hierarchical indexed dataframe
into a html file
'''
@staticmethod
def data_value_func(df):
def _inner(idx, col):
if col == 'gender':
if df.loc[idx, col] == 'F':
return "Female"
return 'Male'
return df.loc[idx, col]
return _inner
@staticmethod
def data_style_func(df):
def _inner(idx, col):
color = '#FFFFFF'
text_align = 'left'
if col == 'count':
text_align = 'right'
if df.loc[idx, 'gender'] == 'F':
color = '#bbdef8'
else:
color = '#e3f2fd'
return html_style.td_style(
text_align=text_align,
background_color=color,
color='#000000',
font_weight='normal',
white_space='pre',
padding='10px',
border=None)
return _inner
@staticmethod
def index_name_value_func(value):
return 'Max By Year'
@staticmethod
def header_value_func(node):
return node.value.capitalize()
@staticmethod
def header_style_func(node):
return html_style.td_style(
text_align='center',
background_color='#4F81BD',
color='#FFFFFF',
font_weight='bold',
white_space='pre',
padding='10px',
border=1)
@staticmethod
def index_value_func(node):
if isinstance(node.value, str):
return node.value.capitalize()
return node.value
@staticmethod
def index_style_func(node):
return html_style.td_style(
text_align='center',
background_color='#4F81BD',
color='#FFFFFF',
font_weight='bold',
white_space='pre',
padding='10px',
border=1)
@classmethod
def render_html(cls):
# Prepare first data frame (same as in render_xlsx)
df = sample_names_data()
# build presentation model
klass_ = HTMLExample4
pm_all = tc.build_presentation_model(
df=df,
output_format='html',
data_value_func=klass_.data_value_func(df),
data_style_func=klass_.data_style_func(df),
header_value_func=klass_.header_value_func,
header_style_func=klass_.header_style_func,
index_style_func=klass_.index_style_func,
index_value_func=klass_.index_value_func,
index_name_func=lambda _: 'Sample Data')
male_df = top_names_for_year(gender='M')
pm_top_male = tc.build_presentation_model(
df=male_df,
output_format='html',
data_value_func=klass_.data_value_func(male_df),
data_style_func=klass_.data_style_func(male_df),
header_value_func=klass_.header_value_func,
header_style_func=klass_.header_style_func,
index_style_func=klass_.index_style_func,
index_value_func=klass_.index_value_func,
index_name_func=lambda _: 'Max by Year')
female_df = top_names_for_year(gender='F')
pm_top_female = tc.build_presentation_model(
df=female_df,
output_format='html',
data_value_func=klass_.data_value_func(female_df),
data_style_func=klass_.data_style_func(female_df),
header_value_func=klass_.header_value_func,
header_style_func=klass_.header_style_func,
index_style_func=klass_.index_style_func,
index_value_func=klass_.index_value_func,
index_name_func=lambda _ : 'Max by Year')
layout = [pm_all, [pm_top_female, pm_top_male]]
# render to xlsx
html = htmlw.HTMLWriter.to_html(
layout, border=1, orientation='horizontal')
output_fp = os.path.join(
tempfile.gettempdir(),
'example3.html')
print('Writing to =', output_fp)
with open(output_fp, 'w') as f:
f.write(html)
|
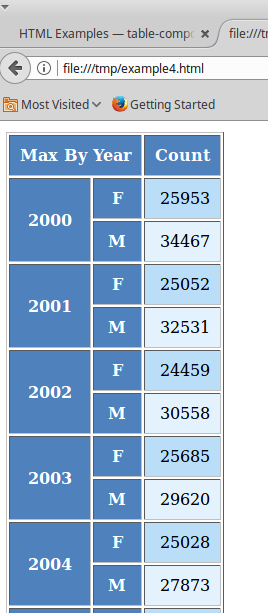
Example 4 - DataFrames with Multi-hierarchical columns and indices
Demonstrates rendering dataframes with multi-hierarchical indices and mult-hierarchical columns
1 2 3 4 5 6 7 8 9 10 11 12 13 14 15 16 17 18 19 20 21 22 23 24 25 26 27 28 29 30 31 32 33 34 35 36 37 38 39 40 41 42 43 44 45 46 47 48 49 50 51 52 53 54 55 56 57 58 59 60 61 62 63 64 65 66 67 68 69 70 71 72 73 74 75 76 77 78 79 80 81 82 83 84 85 86 87 88 89 90 91 92 93 94 95 96 97 98 99 100 101 102 103 104 105 | class HTMLExample4:
'''
Demonstrate styling and rendering of multi-hierarchical indexed dataframe
into a html file.
'''
@staticmethod
def data_value_func(df):
def _inner(idx, col):
if col == 'gender':
if df.loc[idx, col] == 'F':
return "Female"
return 'Male'
return df.loc[idx, col]
return _inner
@staticmethod
def data_style_func(df):
def _inner(idx, col):
color = '#FFFFFF'
text_align = 'left'
if col == 'count':
text_align = 'right'
if idx[1] == 'F':
color = '#bbdef8'
else:
color = '#e3f2fd'
return html_style.td_style(
text_align=text_align,
background_color=color,
color='#000000',
font_weight='normal',
white_space='pre',
padding='10px',
border=None)
return _inner
@staticmethod
def index_name_value_func(value):
return 'Max By Year'
@staticmethod
def header_value_func(node):
return node.value.capitalize()
@staticmethod
def header_style_func(node):
return html_style.td_style(
text_align='center',
background_color='#4F81BD',
color='#FFFFFF',
font_weight='bold',
white_space='pre',
padding='10px',
border=1)
@staticmethod
def index_value_func(node):
if isinstance(node.value, str):
return node.value.capitalize()
return node.value
@staticmethod
def index_style_func(node):
return html_style.td_style(
text_align='center',
background_color='#4F81BD',
color='#FFFFFF',
font_weight='bold',
white_space='pre',
padding='10px',
border=1)
@classmethod
def render_html(cls):
# Prepare first data frame (same as in render_xlsx)
data_df = load_names_data()
data_df = data_df[data_df['year'] >= 2000]
g = data_df.groupby(('year', 'gender'))
df = g.max()
klass_ = cls
pm = tc.build_presentation_model(
df=df,
output_format='html',
data_value_func=klass_.data_value_func(df),
data_style_func=klass_.data_style_func(df),
header_value_func=klass_.header_value_func,
header_style_func=klass_.header_style_func,
index_style_func=klass_.index_style_func,
index_value_func=klass_.index_value_func,
index_name_func=klass_.index_name_value_func)
layout = [pm]
# render to xlsx
html = htmlw.HTMLWriter.to_html(layout, border=1)
output_fp = os.path.join(
tempfile.gettempdir(),
'example4.html')
print('Writing to =', output_fp)
with open(output_fp, 'w') as f:
f.write(html)
|